The dashboard
Revenue, visits and services for today, this week or this month — and what the numbers count.
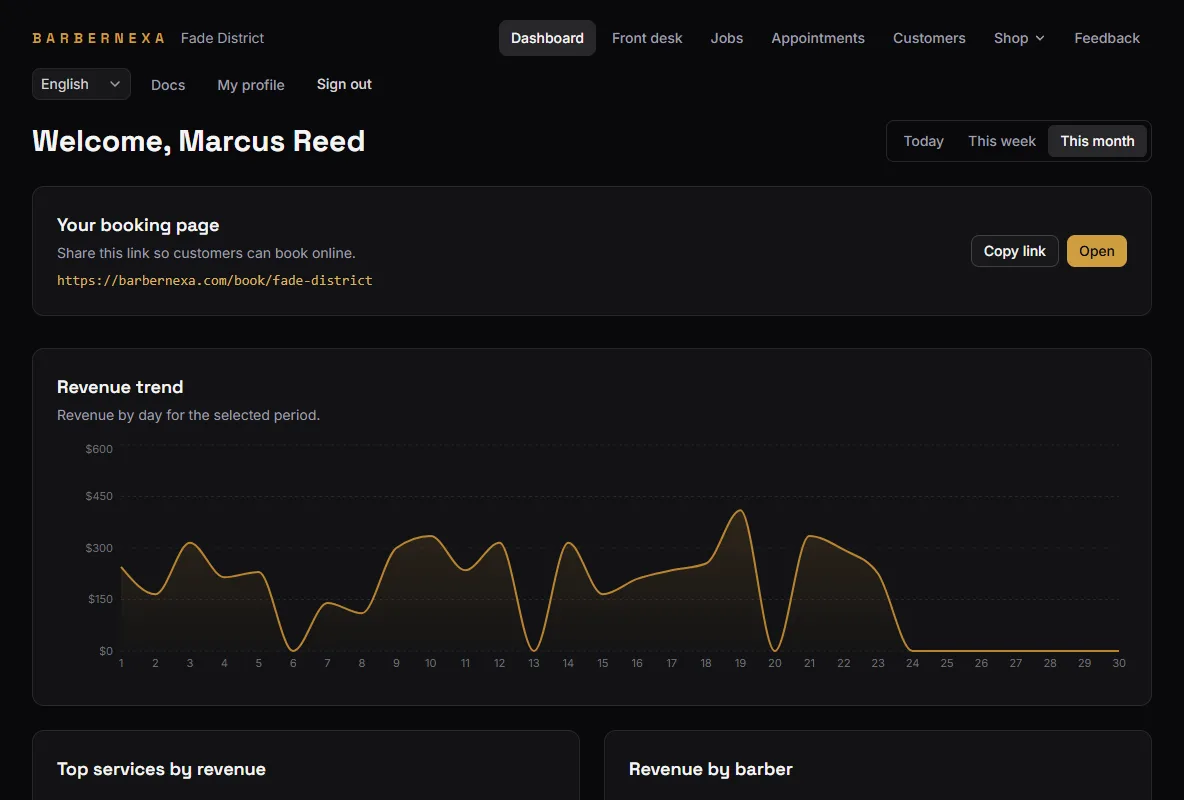
The dashboard answers one question at a glance: how did today go. Switch the period between Today, This week and This month.
Every role sees it.
The four tiles
Revenue — the sum of everything charged on completed visits in the period.
Completed visits — how many were finished.
Latest turn — the highest turn number issued in the period. On Today, this is how many people have come through the door.
Upcoming appointments — scheduled visits from today onward. This one looks forward, not back.
Revenue and Completed visits count completed visits only. A ticket still sitting at Checked in contributes nothing, however much money is on it.
So a day that looks too quiet is usually a handful of tickets nobody closed. Open Jobs, filter by status, and finish them.
Services performed
Every service done in the period, with how many times and how much it brought in. It is the table that tells you which service actually pays for your week, as opposed to which one you talk about most.
Per-barber performance
Barbershop only. Each barber with their visits, the number of service lines they did, and their revenue.
Lines with no barber assigned land in an Unassigned row. A large Unassigned row means the counter is skipping the barber field at check-in — the money is counted correctly, it just cannot be attributed.
On Studio this table does not appear at all, since there is one of you.
The charts
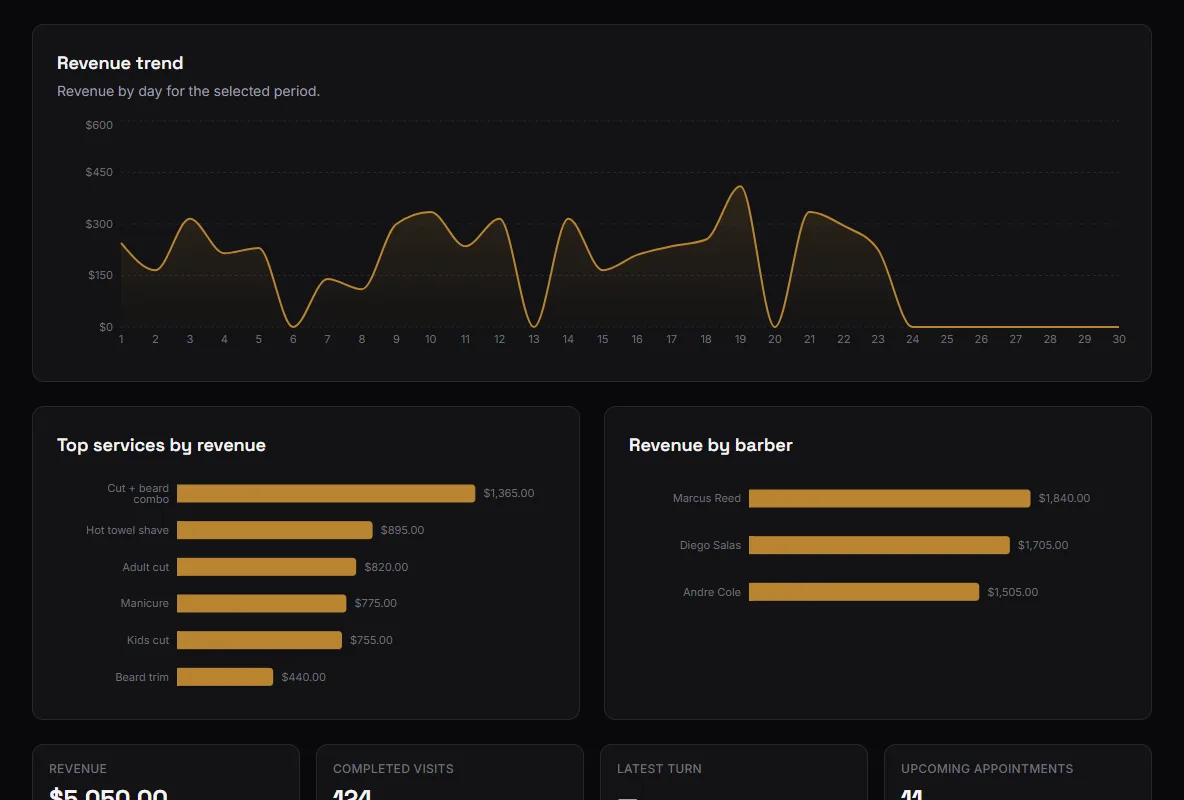
Revenue trend — by hour when you are looking at a single day, by day for a week or a month. The hourly view is the one that shows you when your shop is actually busy, which is what you want before changing your opening hours.
Top services by revenue and Revenue by barber rank the same data the tables below them hold, with smaller entries grouped into Other.
Your booking page
The card with your public link, a Copy link button, and Open to see the page as a customer does. It sits on the dashboard because sharing it is the single highest-return thing you can do in the app.
What the dashboard will not tell you
It has no comparison against last week, no targets, and no forecast. It reports what happened in the period you picked.
For anything else — a month-by-month trend, revenue per barber per service, a real accounting reconciliation — take the raw rows out and work on them properly. See Exporting your data.